Mal es dir aus! Was Datenvisualisierungen für Wissenschaft leisten können
Am 3. Juli veranstalten Elephant in the lab ihr nächstes Meetup zu dem Einfluss von Datenvisualisierungen auf Wissenschaft. Bei Interesse melden Sie sich bitte über die Meetup Website an. Die Veranstaltung ist in englischer Sprache.
Picture it! What data visualisations can do for science
3 July 2019 | 7 pm
HIIG | Französische Straße 9 | 10117 Berlin
When you think of Leonardo da Vinci’s Vitruvian Man or John Snow’s famous map of cholera outbreaks in 19th century London, you think of early examples for data visualisations. In academia, visualisations have always been widely used to communicate findings and make sense of the data. Given that early research was published on paper and distributed analogously, visualisations were static.
Nowadays, there is an ever increasing number of visualisations in papers: statistical results, maps, social networks, you name it. But despite technological advances and modern approaches to data visualisation, published infographics remain mostly static.
What opportunities does science miss by sticking to this (outdated) state-of-the-art? Can publications benefit from the tools and approaches already employed in data science or data-driven journalism? What better ways are there for telling stories with interactive graphs or web apps to make research more compelling?
Bringing together scientists and data visualisation specialists, we give you an insight into the world of visual representations and discuss new ways to explore data. We will encounter the good, the bad, and the beautiful side of data visualisations and give you some inspiration for your own research. Just picture it!
Speakers
- Katrin Glinka is with the Prussian Cultural Heritage Foundation (SPK) where she is the Scientific Project Lead of museum4punkt0. She is also a lecturer at the University of Applied Sciences Potsdam. In her research she focuses on digitisation and visualisation in the cultural field and its means and potentials for curation, critical and interventionist approaches, and visitor orientation in museums.
- Christoph Maurer is a Senior Designer and Frontend Developer with specialisation in Design Thinking, UI- & UX-Design, and data visualisation. He works for international clients and small business from various fields.
- Julius Tröger is a journalist and book author. He is Head of Visual Journalism with ZEIT ONLINE. At his former employee Berliner Morgenpost, he founded the multi-award winning Interaktiv-Team. He was a guest author at Guardian US and ProPublica.
Agenda
| 7 – 7.30 pm | Networking / Get-together with pizza and drinks |
| 7.30 – 7.40 pm | Introduction |
| 7.40 – 9 pm | Speakers + Q&A Session |
DIGITAL SOCIETY VORTRÄGE
Diese exklusive Vorlesungsreihe entwickelt eine europäische Perspektive zu den aktuellen Transformationsprozessen innerhalb unserer Gesellschaft.
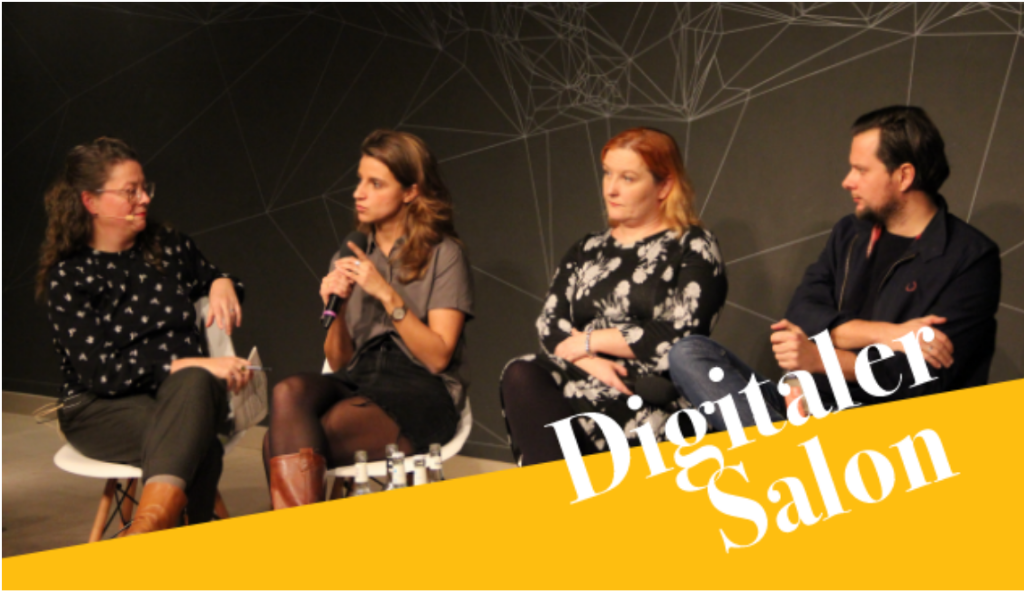
DIGITALER SALON
Einmal im Monat laden wir ausgewählte Gäste ein, um gemeinsam mit dem Publikum über die Auswirkungen der Digitalisierung auf die Gesellschaft zu sprechen.
NEWSLETTER
Erfahren Sie als Erstes über neue Events und spannende Forschungsergebnisse.

